
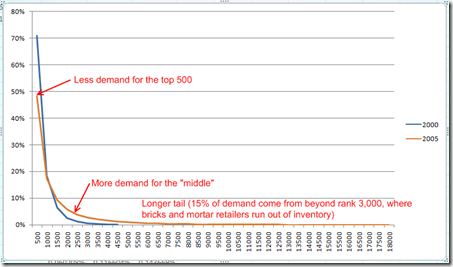
Netflix data shows shifting demand down the Long Tail
The vertical axis is percentage of total demand (with ratings used as a rough estimate of rentals), and the horizontal axis is the popularity rank of the DVD titles. Between 2000 and 2005, the Netflix selection grew from 4,500 DVDs to 18,000, and the effect on the demand of this increase in variety is shown above.
Seen at The Long Tail
Notes
robgo-blog liked this
 josephweisenthal-blog liked this
 infoneer-pulse liked this
roomthily liked this